QR Code Error Correction Levels: A Real Damage Test
By Junaid Aslam. 6 min read. Updated .
The four error correction levels are usually quoted as 7, 15, 25, and 30 percent recovery. Those numbers describe the error correction codewords in a block, not a promise that a printed code survives that much visible damage. This test measured the printed area instead.
We generated one 87-byte URL at L, M, Q, and H in the QR Code Generator, covered 1 to 50 percent of each code with a black square, and decoded every image with jsQR. Three of the four levels stopped below their quoted figure in every placement. The bottom-right corner failed first, at 1 to 2 percent for Q and H.
The four codes
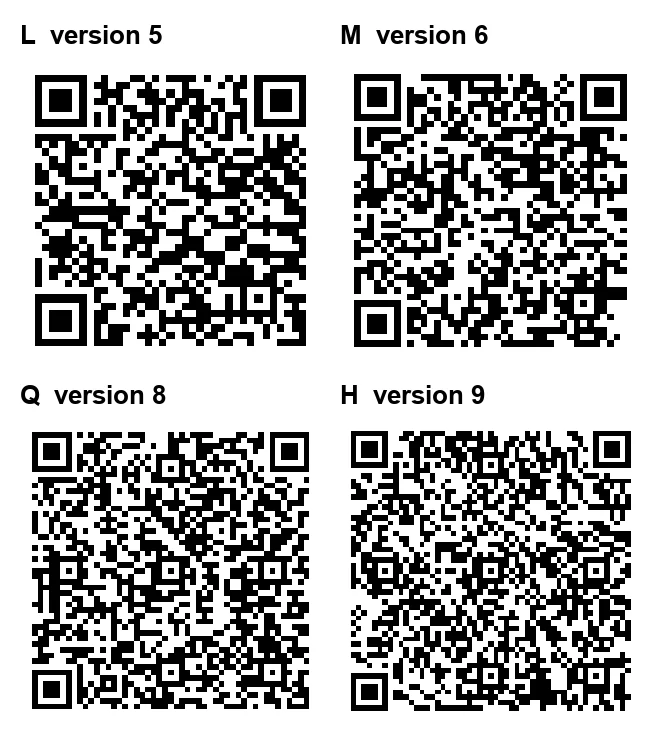
The URL is https://instanttools.io/guides/qr-code-error-correction-levels?test=damage-and-capacity. It is 87 bytes in byte mode. The generator used its default 256 px size and a 2-module margin.
| Level | Version | Modules per side | Byte capacity at this version |
|---|---|---|---|
| L | 5 | 37 | 106 |
| M | 6 | 41 | 106 |
| Q | 8 | 49 | 108 |
| H | 9 | 53 | 98 |
The versions come from the decoder output, not from a setting. The capacity values come from the byte-mode table in Thonky's QR tutorial, which lists 106 bytes for 5-L, 106 for 6-M, 108 for 8-Q, and 98 for 9-H. Each code is the smallest version that holds 87 bytes at that level.
Why Q and H jump in size
The next smaller versions are close to the limit. Version 7-Q holds 86 bytes, one byte short of this URL, so Q needs version 8. Version 8-H holds 84 bytes, so H needs version 9. That is why the four codes do not share a size.
| Level | Total data codewords | EC codewords per block | Blocks |
|---|---|---|---|
| L, version 5 | 108 | 26 | 1 block of 108 |
| M, version 6 | 108 | 16 | 4 blocks of 27 |
| Q, version 8 | 110 | 22 | 4 blocks of 18 and 2 blocks of 19 |
| H, version 9 | 100 | 24 | 4 blocks of 12 and 4 blocks of 13 |
The block table is the part the percentage describes. Reed-Solomon correction works on codewords inside each block. A block with 26 EC codewords can repair up to 13 bad codewords in that block, not 26 percent of the printed squares. A larger block of damage can cross block boundaries and still decode, or it can break the decoder's ability to find the code at all.
How the damage test ran
Each level was generated three times on 2026-11-17. The three PNGs per level were byte-identical, with the same SHA-256 hash. The repeat runs therefore test the decoder and the damage script, not random differences in generation.
For each image, we found the dark module bounding box and covered a black square whose area is a set percentage of that box. The quiet zone was left clear. The square went in one of three places: the center, an offset point at 72 percent of the width and 28 percent of the height, or the bottom-right corner. Sizes were 1, 2, 3, 4, 5, 10, 15, 20, 25, 30, 35, 40, 45, and 50 percent.
The decoder was jsQR 1.4.0 in Chromium, fed the raw RGBA pixels of each PNG. We decoded 504 damaged images and the 12 clean ones. Every successful decode returned the exact 87-byte URL. There were no partial or corrupted reads.
Results
Each cell shows the largest tested area that decoded in all three runs, then the next tested area that failed in all three. A value of 4 / 5 means 4 percent worked and 5 percent failed.
| Level | Quoted | Center block | Offset block | Corner block |
|---|---|---|---|---|
| L | 7% | 4 / 5 | 5 / 10 | 2 / 3 |
| M | 15% | 10 / 15 | 15 / 20 | 2 / 3 |
| Q | 25% | 20 / 25 | 15 / 20 | 1 / 2 |
| H | 30% | 20 / 25 | 10 / 15 | 1 / 2 |
Only M reached its quoted figure, and only with the offset block. L's best passing block was 5 percent, Q's was 20, and H's was 20. The corner block failed at 1 to 2 percent for Q and H, and at 2 percent for L and M.
What the numbers show
- The quoted percentage is not an area budget. L's best passing block was 5 percent, below its 7 percent figure, and Q and H stopped at 20 against 25 and 30.
- Placement matters more than the level in this test. A 2 percent corner block killed Q and H, while a 10 percent center block still decoded at M.
- H did not beat Q. Both stopped at 20 percent in the center. H is version 9 with 53 modules per side, so the same area is more modules and a different block layout.
- The corner is the weak spot. Versions 5, 6, 8, and 9 place an alignment pattern at the bottom-right, at (30,30), (34,34), (42,42), and (46,46). The corner block covers it. Thonky's alignment table gives those positions, and the early failure matches them.
- A decoder can fail before error correction runs. jsQR has to find the finder patterns, the timing pattern, and the alignment patterns before it reads data. A block over a function pattern can stop the scan while the data codewords are still recoverable.
What this means for a printed code
Choose Q or H when the code may get scuffed, but do not read 25 or 30 percent as a guarantee. In this test, Q and H tolerated 20 percent in the center and only 1 percent in the bottom-right corner.
Keep the quiet zone clear. Leave the three finder patterns and the alignment patterns uncovered. A logo in the center is safer than a mark near a corner, and the QR Code Generator locks the level to H when a logo is set. Test the actual print with the phone and app your readers use.
Tested on
2026-11-17, against commit 975c67a on a local production build (Next.js 14.2.35). Codes came from the QR Code Generator at its default 256 px size. Damage was applied with Pillow in Python 3.10. Decoding used jsQR 1.4.0 in Chromium through Playwright. The capacity and block values were checked against Thonky's QR tutorial tables on the same day.
Primary sources
- Thonky: Character Capacities by Version, Mode, and Error Correction: the byte-mode capacity table used for the version selection.
- Thonky: Error Correction Code Words and Block Information: the data codeword counts, EC codewords per block, and block layout for 5-L, 6-M, 8-Q, and 9-H.
- Thonky: Alignment Pattern Locations: the (30,30), (34,34), (42,42), and (46,46) positions.
- jsQR: the decoder used for every image.
The ISO/IEC 18004 standard is the original source for these tables. It is sold as a PDF, so this guide cites the tutorial tables and checks every value it uses.
Photo credits
This guide has no photos. The four QR codes are generated images from the QR Code Generator, and the composite figure was assembled from those files.
Related tools
- QR Code Generator: generate a code at L, M, Q, or H and download a PNG or SVG.
- Image to Text: read text from a photo of a label or sign.
- AI Image Analyzer: ask what is in a photo or screenshot.